Published: Nepali Times, 15 October 2023
Why it is important to track consumption habits of the increasing numbers of Nepal’s internet users
Nepal’s digital topography is undergoing dramatic change, with traditional mass media being rapidly subsumed by digital portals and social media platforms as the primary source of news and information. This has resulted in a fragmented radio, TV, and print with a migration of audience eyeballs.
While a significant portion of Nepal’s population is engaged in the internet and social media, the noise in this sector also poses challenges. It is essential to leverage accurate and up-to-date data to develop an effective media campaign strategy. This holds true for political figures, election publicity, marketing of products, and even for the media business itself.
To navigate this dynamic environment successfully, having live and accurate analytics on media consumption patterns is crucial. Nepal Media Survey (NMS) by Sharecast Initiative has been filling this gap by providing valuable insight into media industry stakeholders, institutions using media for advocacy, and others interested in audience data.
The annual NMS report sheds light on media consumption patterns, trust levels, and access to media, enabling organisations to refine their strategies and connect with their target audience more effectively. Nepali Times has been analysing the data emerging from these surveys every year to forecast future trends in device use and popularity of platforms.
The survey adopts a multi-stage cluster sampling design with the first sampling unit being the district, followed by municipalities, then wards and finally households. The probability-proportion-to-size method is used for the first three stages to ensure representative selection. We employ the right-hand rule in the fourth stage to identify the household. In the final stage, we conduct a random lottery method to select respondents.
The survey collects critical demographic and geographic data about each survey respondent. Each question can provide additional insight that helps understand user perception and behavioral aspects, and create a more comprehensive market understanding.
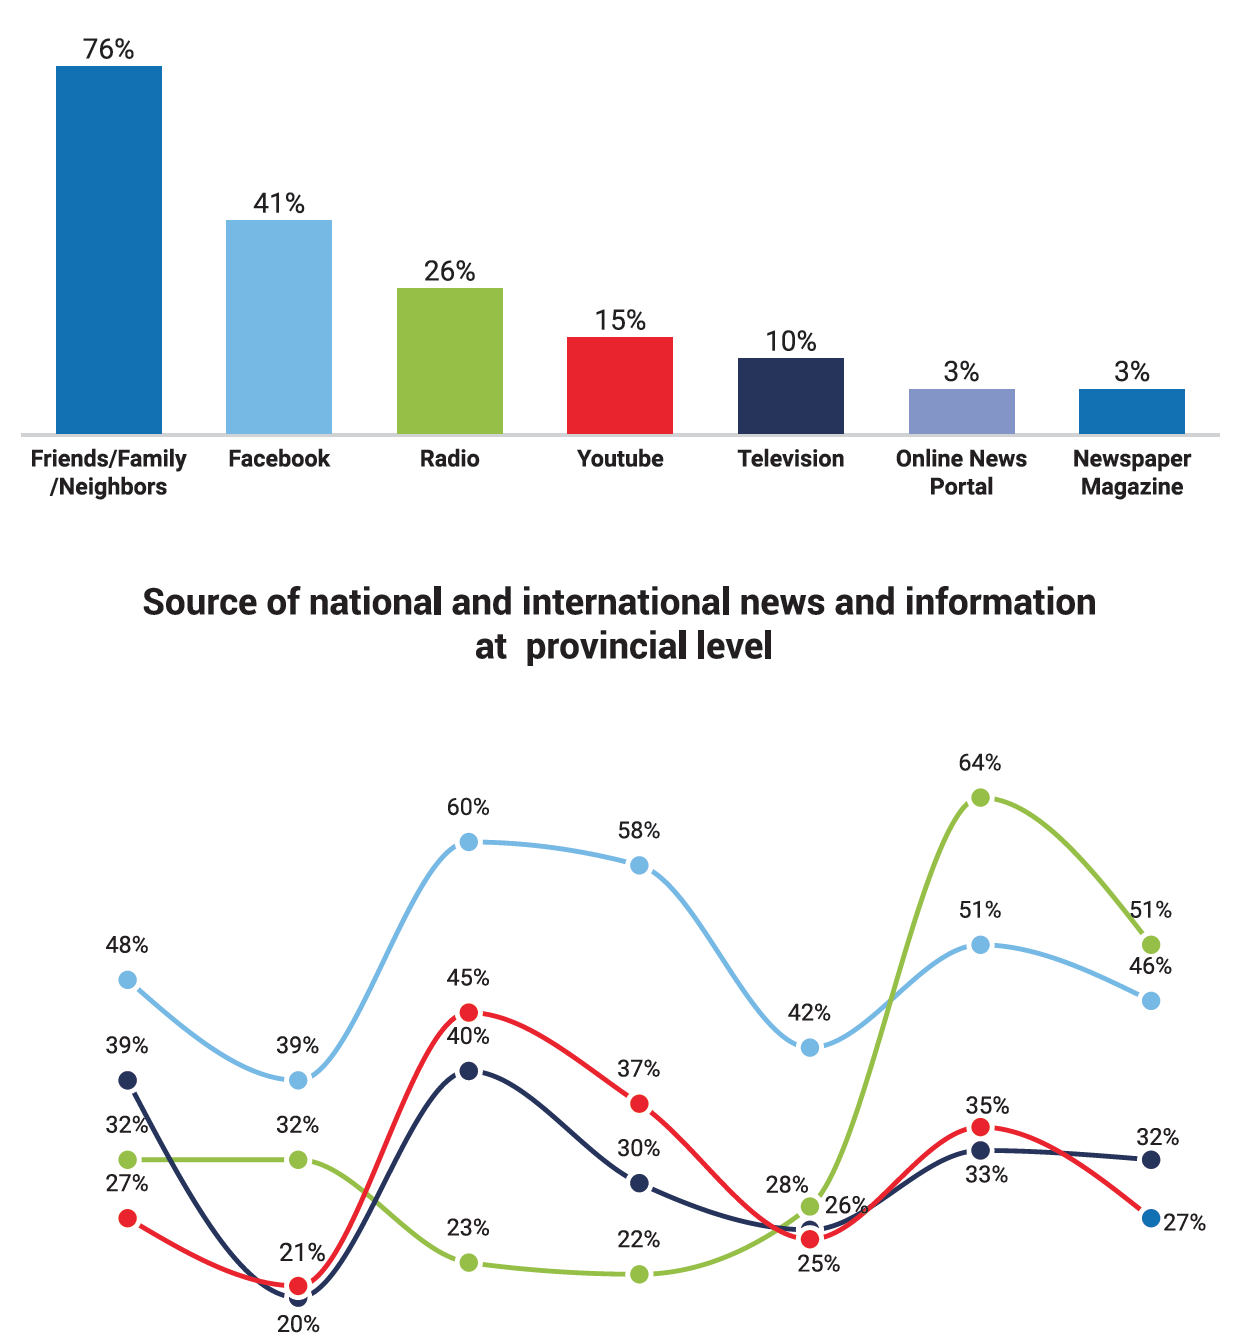
Apart from age, gender, and geographic location (Probability proportional sampling (PPS) method at the provincial level), the survey covers income level, education level, occupation, living standard measurement, mobile device ownership, and internet access. Each question can be cross-referenced or correlated to another question covered in the survey.
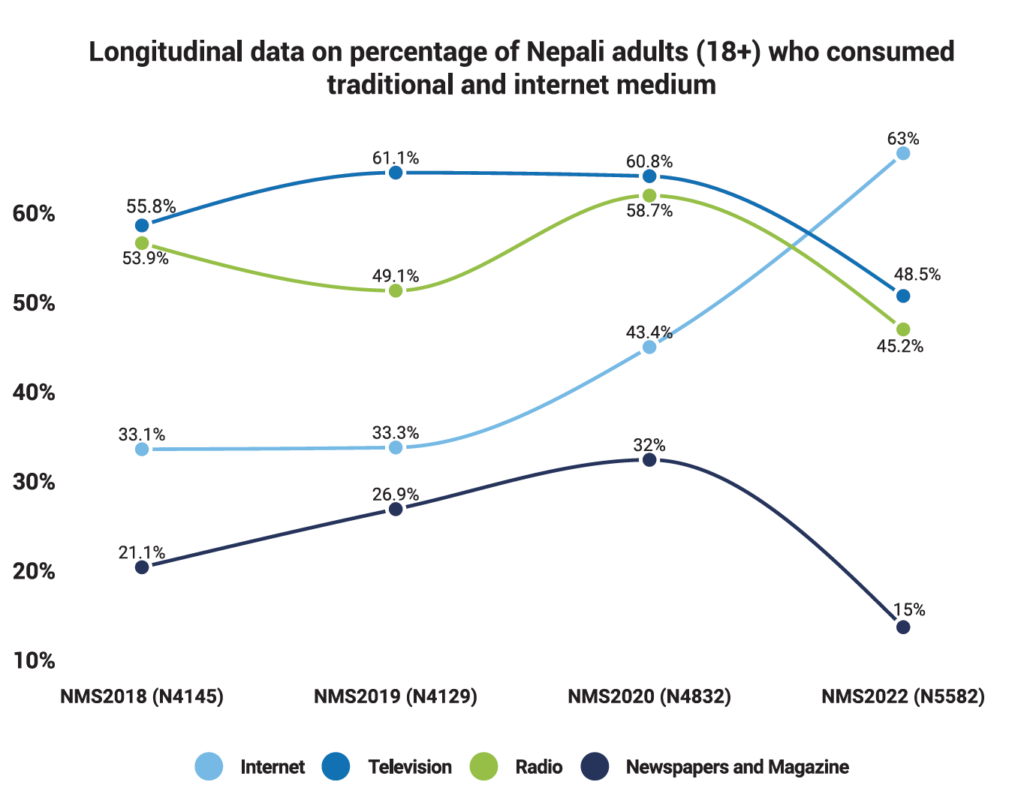
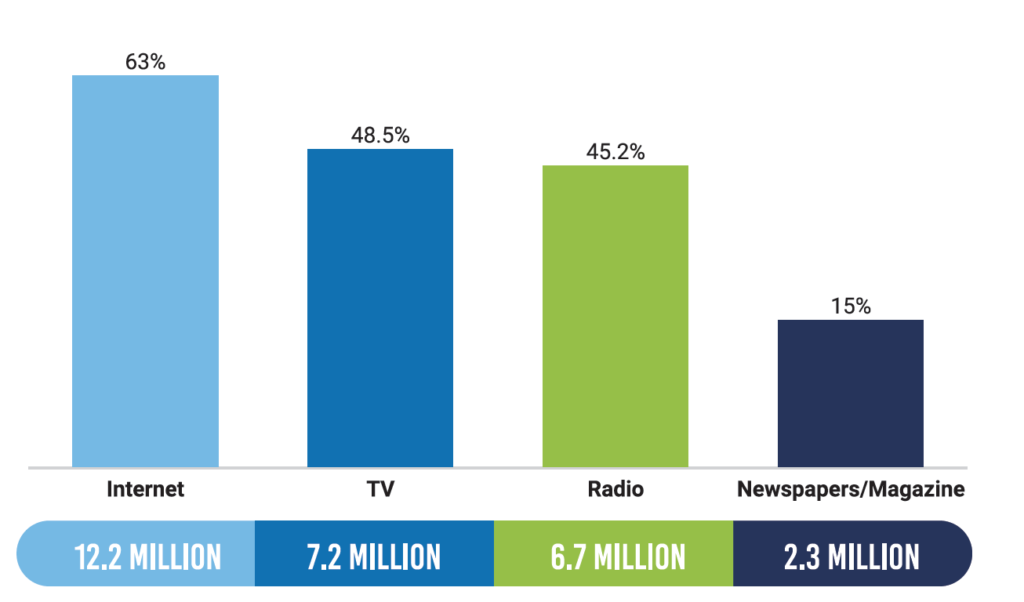
Past polls found a sharp increase in access to the internet and digital media platforms in 2022 compared to 2020. Trends since 2018 reveal a radio listenership spike during key socio-political events and natural calamities. The average national listenership for radio was 45% in March 2022. That year, 48% said they watched tv regularly, a surprising 12.3% point drop compared to 2020.
Newspaper readership continues to decline. Compared to 2020 (32%), only 15% of respondents said they read newspapers regularly in 2022. Consumers of all three legacy media reasoned that it was ‘unnecessary’ to read papers and magazines, and they got what they needed from social/digital media outlets.
The overall trend showed that radio audiences moved to Facebook, and linear tv audiences moved to YouTube and TikTok for news and information.
Despite the surge in digital media users and social networking sites, however there persisted a trust deficit among users who said they still relied on legacy media to verify the accuracy of information – mainly the radio and tv news bulletins.
As the use of smartphones and broadband internet access gets cheaper and spreads wider, the speed and bandwidth of internet connections are improving. Due to improved quality and affordability, dependency on personal mobile devices to get online is expected to increase further.
This changing pattern of consumption of media content is now determined by access to new devices and services. Just as FM listenership surged with Nepal’s rural radio revolution in the 1990s, the beginning of 2000, television took the audience away from print during the same period.
The second decade of the millennia put radio, tv, and print in the same boat, and they compete with the internet for eyeballs and revenue share.
This year’s NMS will continue to track users of legacy media while also tracking access to mobile devices and quality of the internet, digital media platforms covering user behaviour on major social media platforms. We are especially interested in testing the trust level and knowledge to test the validity of the information they receive through different platforms.
The 2023/24 survey also has new questions to help understand e-commerce behaviour and consumption of Nepali online news portals, influencers, harassment/cyberbullying/misinformation, and disinformation patterns.
Sharecast Initiative plans to release separate reports for digital and legacy platforms and thematic areas for this year’s survey, and will continue to monitor the ranking of significant legacy media which will be valuable for companies and advertisers to reach consumers and gauge their media preferences.
https://nepalitimes.com/opinion/comment/surveying-nepal-s-digital-landscape